Andy McGraw – Fall 2020
Introduction
Police noise complaint records in Central Virginia reveal dense intersections of race, gender, sound, and governance, summarized in the terse dispatch transcripts patrol officers receive on their computers. Three examples:
“5 black females talking too loud;”
“mexicans playing that loud bass;”
“subj at this addr comes outside every night yelling ‘obama obama’ and ‘once you go black you never go back.’”
In this article I use statistics and mapping to analyze relationships between social data and noise complaints. I will show that higher homogeneity in party affiliation and social demography often correlates with fewer noise complaints. Complaints appear to correlate with incursions of new populations and shifts in political party dominance in an area over time 1. This suggests that noise complaints are associated with a fear of loss of social control over territory.
Setting the Scene
The noise datasets I’m using are drawn from the city of Richmond and the surrounding counties of Chesterfield, Henrico, and Hanover. Chesterfield, described by the Washington Post as a “bastion of Virginia-brand conservatism,” voted Republican in the last five presidential elections but in November 2017 backed the Democrat for governor for the first time since 1961. Chesterfield’s political landscape has recently shifted with new groups moving in and long-term residents, primarily suburban white women, changing party affiliation. Henrico voted Democrat for the first time in the 2016 presidential elections, a shift attributed to increasing numbers of non-white populations in the county, primarily Black and Hispanic. Hanover remains strongly Republican; no Democrat has won there since Harry Truman. Richmond itself is solidly Democratic, partly as a consequence of White flight into the surrounding counties from the 1950s to the 1990s and that constituency’s political shift from “Southern Democrat” to Republican.
Overall, there are more noise complaints in the more Republican counties as compared to the city, even after controlling for total population. There are .176 complaints per capita in Richmond for the period between 2007-2019, as compared to .379, more than two times, complaints per capita in Chesterfield for the same period. This difference is even more marked for the ante-Trumpian period, prior to 2016, before these staunchly Republican counties began to become more politically heterogeneous.
Despite these differences, analyzing the relationship between noise and politics at the county level doesn’t provide a very statistically significant measure. For this we need to look at tract and block level geographies. Over the course of this article I’m going to zoom in to smaller and smaller geographic scales, where things start to get complicated. My central thesis is that noise complaints are indicative of general social tension in a geographic area. People’s relationships to their neighbors—informed by attitudes about class, race, and politics—partly determines how they cope with their neighbor’s sounds 2. The act of complaining to the police may be a sign of anxiety about social control or an expression of dominance and privilege. Every one of the complaint records on the map below represents a judgement, a determination about whether or not a sound is “good” or “appropriate,” as well as a sense of privilege. Most complainants probably feel that they have the right to the call police and they likely expect a response in their favor; a response that won’t potentially backfire on them.
Complex Datasets
First a caveat; these are complex datasets. Many noise studies assume that complaint data represents members of a local community calling on each other, and so comparing complaint data with local demography is justified. But this is not necessarily the case. Records could represent members of a local community complaining about outsiders. For instance, African American kids partying in a park in an historically White neighborhood. Complaints can be in reference to temporary construction noise. It is also possible that officer-originated noise complaints could be a component of racialized pre-textual policing practices—stopping outsiders going through a community—a phenomena I’ve analyzed elsewhere as a form of sonic stop and frisk. While complaints can originate with an officer on duty, none of the police departments I obtained data from distinguish these in their data. They will only tell me that it is “rare.” Furthermore, policies for responding to and recording noise complaints and citations often differ between police departments. Records from Richmond and the adjacent counties are slightly different and undoubtedly reflect different policing practices.
Another challenge arises from the fact that demographic and political data isn’t always available at the same geographic level. I am using Esri datasets, which provide very rich demographic data at the tract level, whereas my party affiliation data goes down to the block level, which is usually about half the size of a tract. Finally, demographic data often includes complex interactions amongst its variables. Demographic data such as combinations of race and income sometimes serve as a reliable proxy for political party affiliation. In statistics this is called “multicollinearity.”
Clearly, there can be many reasons behind a noise complaint, and this probably means that we can’t get at causation through data analysis alone. If you really want to know why particular people are complaining then you need to do on-the-ground ethnographic work, and trust that people are telling you the truth.
Noise Ordinances
The Richmond noise ordinance is extremely restrictive. 75 dB during the day, 65 dB at night when measured outside a structure.
. . . exceeds 55 dBA during nighttime hours and . . . . 65 dBA during daytime hours when measured inside a structure, or sound that exceeds 65 dBA during nighttime hours and . . . 75 dBA during daytime hours when measured outside a structure. . . .
(Richmond City Noise Ordinance, passed 2011)
The ordinances in Richmond and the surrounding counties were rewritten around 2011 as a response to a successful 2009 ACLU lawsuit against Virginia Beach. The state supreme court agreed with the ACLU that the old Virginia Beach ordinance was unconstitutionally vague, enabling officers to use it as a proxy for racialized policing. In response, Richmond and the counties rewrote their ordinances, specifying low decibel levels. In effect, this allowed the continued use of sound as a proxy for racialized policing in these areas. The county ordinances remain relatively vague. In Henrico “noise” refers to sounds that can be heard from 100 feet away outside a residence at night; in Chesterfield it’s 50 feet away. However, I imagine very few complainants actually know what their local ordinance is, and it’s important to remember that noise datasets don’t measure noise, they measure complaints. You can complain whether or not the sound violates the ordinance, and that complaint is represented in the dataset.
Statistics
In the following discussion I will be referring to statistical correlations between noise complaints and social data. In this section I provide a brief description of the statistical measures I use and how readers should interpret them.
In scatter plot graphs in which you have, for instance, number of noise complaints going up on the y axis and a predictor variable—such as total population—increasing left to right on the x axis, the correlation coefficient, represented as R-squared, describes how tightly your data fits the regression line. An R2 of 0.3 means that your model explains 30% of variation within the data. This isn’t causation; it shows how closely two variables might be related. A perfect positive correlation would be an R-square value of 1, in which all dots are perfectly on the line, indicating that your model perfectly describes the data. A mild correlation would be around .2. Anything below that is sometimes considered not to represent a correlation. But R-square values in the humanities, social sciences, or arts tend to be on the low end, because these kinds of datasets are hypercomplex; their dependent variables tend to be affected by many factors others than those considered in the analysis.
Statisticians like to use a (possibly apocryphal) story to explain the difference between a statistical and a substantive, causal, explanation: “The number of births in a [particular region of Sweden] can be estimated reasonably well from the number of storks in the same area; if we ran a regression with the number of births as the dependent and the number of storks as the independent variable, we . . . get a . . . large R2 value” (Moksony 1990:3). But it’s unlikely that the storks have any causal relationship to fertility, which tends to be higher in rural than urban areas. Storks tend to live in rural areas and thus are a good predictor of fertility, although they have no causal or explanatory relation to it. So R2 is not a good measure of the strength of the effect of the independent variable (say, total population) on the dependent variable, in our case, noise count. For this reason, multiple regression can be a better measure, and so I include this as well. Multiple regression measures the “relative predictive power of several independent, predictor, variables on a dependent variable” 3. This allows us to do several things: examine how much the predictor variables, in combination, are related to noise complaints; examine the strength of each of the predictor variables on the dependent variables, while controlling for the other variables in the model; and examine any possible interaction effects between them. In multiple regression the P value is the most relevant measure; this is the statistical significance of the relationship. Anything below a P value of 0.05 is generally considered statistically significant.
Maps
I often map data first to eyeball whether or not there might be a connection worth investigating statistically. Below is a combined image of party affiliation in the area—the redder the more Republican, the bluer the more Democratic. Tan areas don’t have enough relevant data; the tan tract on the right is the airport. Noise complaints are represented by bubbles; the larger the bubble the more complaints. Richmond is in the center; Chesterfield is to its south; Henrico is the arc around the north of the city. Any possible correlations seem pretty ambiguous in this map.

The Esri political affiliation datasets allows you to filter by political bent as well. However, correlations between noise and strongly conservative or liberal tendencies don’t seem apparent.


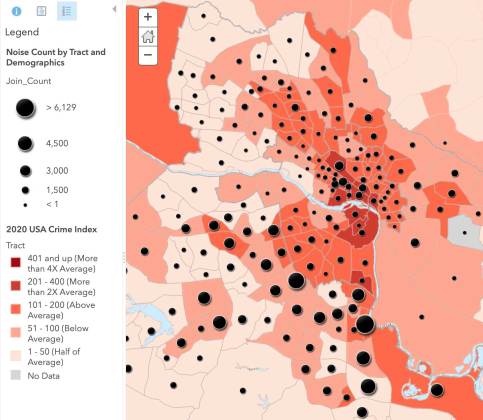
Neither does noise appear to correlate with either crime or incarceration statistics.

Correlations and Regressions:
Population, Age Cohort, and Income
When considered across the entire Richmond metro, only some demographic categories are correlated with noise in a meaningful way. Let’s look at the basic measures of population first. For the entire metro, overall population is a statistically significant predictor of noise, but has very weak predictive power, explaining only seven percent of the variance in the noise dataset. I was surprised that population density is not a statistically significant predictor of noise. This is the case at multiple levels, from the metro to the block level geography.

I was also surprised that neither home ownership or number of renters in a tract are correlated with noise complaints. I would have thought that home ownership indicated more long-term investment in the community, knowing one’s neighbors, and realizing that calling the police on them might not be the best way to manage relationships.

Age cohort explains 19% of variance in noise at the metro level. But individually, only the Millennial population count is a statistically significant predictor of noise, much more so than any of the other age cohorts.
Median Household income and unemployment are also statistically significant predictors of noise at the Metro level. As income goes up, complaints go down; as unemployment goes up noise complaints go up; but again this is a very weak effect. Here we should remember how demographic data often entail multicollinearity; race is tightly correlated with income.
Median Household Income and Noise Complaints

Unemployment and Noise Complaints
Race
The total count of Hispanic population and Black population in a tract are statistically significant predictors of noise at the Metro level. But this is not the case for white population. However, when considered as a percentage of population at the tract level, only the percentage of Hispanic population is a statistically significant predictor of noise, whether or not they live in detached homes or in apartments.
Below is a map of the relationship between Hispanic population and noise counts.

Esri’s Diversity Index, which measures the overall demographic heterogeneity in a tract, is also a statistically significant predictor of noise. When either the Hispanic population or the Diversity Index go up, noise complaints tend to go up as well.
Esri Diversity Index and Noise Counts

When filtering the dataset to only include Richmond block geographies, no single race, when considered as a percent of the total block population, is a good predictor of noise in the city. Is residing in a racially heterogeneous urban area correlated with a greater tolerance of others’ sounds? This measure seems to suggest this might be the case. However, this seems to contradict the correlations seen earlier with ESRI’s Diversity Index.
Loud Music
Now let’s consider select tracts from Chesterfield, a crescent of 18 tracts with especially high noise complaint levels. Here is a pie chart showing the types and relative amounts of noise complaints for the Chesterfield datasets for the period 2007-2019. Only total population and age cohorts show mild correlations with noise complaints. But these effects change or disappear if we filter for loud music complaints only.


After running this filter, no race, as a percentage of tract population, is a statistically significant predictor of loud music complaints; neither is income. Only Millennial and Gen X cohorts, as a percentage of tract population, are statistically significant predictors of loud music complaints in this area. The percentage of Millennials is a much stronger predictor.
Zooming in to the street level you can see patterns that are washed away by the statistical measures in larger geographies. You can see how complaints sometimes cluster around apartments and parks, especially during the summer months. Below is an image of a Chesterfield tract with a very high number of Loud Music complaints. You can see that there are far more complaints in the apartment complex on the south than in the neighborhood of detached homes to the east. But the apartment complex in the north has comparatively few complaints. What is different about these two apartment complexes? Does one have thicker walls? Do they have substantially different demographics? Because we don’t have demographic information at this level, we would need to switch to ethnographic methods to try understand what’s happening here.

Politics
Now let’s consider party affiliation. In Richmond, after controlling for the effects of total population, the percentage of Democrats as a percentage of block population is not a statistically significant predictor of noise complaints, but the percentage of Republicans is. But this is a weak correlation. Looking at Loud Music complaints at our select Chesterfield tracts shows the opposite tendency. In these tracts the number of noise complaints goes down as Republicans, as a percentage of tract population, goes up.
What I think is more interesting here is the question of social change and control. Some of the strongest correlations I found were related to changes in party dominance over time. For block geographies in the city, change in party dominance between 2016-2020 is a statistically significant predictor of noise complaints. The direction of the flip—Democrat to Republican or vice versa—is not a good predictor of the number of complaints. This suggests that issues of contested social control are related to noise complaints, and this social dynamic partly explains, I think, the correlations we saw earlier between noise complaints and the Hispanic population.

A 2020 study conducted by one of my undergraduate students, Henna Ragoowansi, on noise complaints in mobile home parks is informative here. Henna looked at two parks: Forest Meadows in Henrico and Harbour East Village in Chesterfield. The parks have roughly equal populations—about 200 units each—and are in tracts with roughly equivalent populations. Informal research suggests that the demography of the parks parallels the demography of the tract as a whole. These are not racial enclaves.


However, as compared to Forest Meadows, Harbour East Village has far more noise complaints, more than four times that of Forest Meadows. The tract that Harbor East Village is in is more racially diverse—despite a dominant white majority—and has a roughly equal number of Republicans and Democrats. Forest Meadows is in a tract with a slight African American majority, but which is strongly Republican. There is a nearly 3:1 ratio of Republicans to Democrats in the Forest Meadows tract—the community with fewer noise complaints—where Republican dominance has increased significantly over the past five years.

In the Harbour East Village tract, only 54% of residents are affiliated with the Republican party. Henna argued that the nearly 1:1 ratio between Democrats and Republicans around Harbour East Village increases the chances of encountering opposing political views and this may be associated with affective polarization between neighbors. The high number of noise complaints in the area may be an expression of the social tensions emerging from affective polarization.

The Hispanic Population
I want to return now to the correlations between noise complaints and Hispanic population, a community that has grown very rapidly over the past two decades in the Metro area, although the rate of growth has slowed substantially over the past few years. The Hispanic population tends to be lower income and concentrated in apartment complexes in Chesterfield and South Richmond. Here again is the map showing Hispanic population density and noise complaints.
I think the correlation between noise complaints and the Hispanic population is primarily a reflection where they can afford to live. However, even after controlling for the number of renters in a tract, Hispanics are still mildly correlated with noise complaints. I was only able to get police transcripts for noise complaint calls for Hanover, a very white Republican county immediately to the North. Several of those complaints refer to some version of, to quote one of the transcripts: “That loud Mexican bass.” The transcripts include several references to “Spanish Music,” “Hispanic individuals,” and “Mexicans”. (Most Hispanic immigrants to Richmond are from El Salvador; only 18% are from Mexico.)
Hispanics in the Richmond metro are in a somewhat analogous social position to Italian migrants in Victorian England, who were often the target of early noise ordinances (Novak 2015: 130). I wondered if Trump’s nativist political rhetoric and racist immigration policies between the 2016 campaign and the first half of his term might correlate with higher complaints against “Hispanic noise.” In 2014 Hispanics were only 6% of the Metro population, and 7.5% of the Chesterfield population. In 2018 those numbers had gone up to 6.7% and 9% respectively. Linear regression analysis shows that the strength of correlation between Hispanic populations and noise complaints goes up a bit in 2016, but back down again to 2013 levels the next year. This mild bump is mirrored in complaint transcripts from Hanover. Complaints referencing Hispanics were highest in 2012 (the earliest date for which data is available), going down each year until 2016 when only two such complaints were recorded. In 2017 they went up to seven complaints, before going back down to only one in 2018 and 2019. This seems to track Trump’s anti-immigrant rhetoric, although the total numbers of complaints aren’t high enough to provide statistical significance. It’s my hunch that racialized complaints were higher in these areas in the early aughts, when the rate of Hispanic population increase was higher, and that they gradually subsided as Hispanics became more established in the community, creating relationships with neighbors.
Conclusion
Many studies4 apparent connections between increasing demographic heterogeneity and increases in social tension are based upon survey data with small sample sizes. I suggest that research on the relationship of sound to social tension might more productively begin with a statistical analysis of public datasets. Exploring police records has led me to think that analysis and visualization of such datasets can actually be a productive way to explore the affective geography,5 especially when the data includes rich ethnographic information. This is an approach that enables us to explore the relation between sound, governance, and civil society. And when chronological data are available, statistical measures and maps can even suggest how the sonic atmosphere of a place transforms over time.
But it is important to remember that this approach does not get us to causation. While data analysis and visualization can help us frame questions that we might not have previously considered, they would never be enough to tell us exactly what motivates someone to complain to the police, rather than to work out social tensions face-to-face. For this kind of understanding we do need on-the-ground ethnography, and lots of it. But data analysis can suggest to researchers which neighborhoods to start walking in and what questions to ask.
References
Iyengar, S., Sood, G., & Lelkes, Y. (2019). “Affect, Not Ideology: A Social Identity Perspective on Polarization,” The Public Opinion Quarterly, 76(3), 405–431.
Legewie, J., & Schaeffer, M. (2016). “Contested boundaries: Explaining where ethnoracialdiversity provokes neighborhood conflict,” American Journal of Sociology, 122(1), 125–161.
Mühlhoff, R. (2019). ‘Affective Resonance’. In J. Slaby and C. von Scheve (eds.) Affective Societies: Key Concepts. New York, NY: Routledge.
McGraw, Andy. (In press). “Sonic and Affective Geographies in Richmond Virginia.” In J. Love and J. Fillerup (eds.) Contested Frequencies. Bloomsbury.
McGraw, Andy. (In Press). “Feeling the Feels: Spinozist Ethics and Musical Feeling in an American Jail.” Culture, Theory and Critique.
Moksony, F. (1990). “Small is Beautiful: The Use and Interpretation of r2 in Social Research,” Szociológiai Szemle, Special issue. 130-138.
Park, S. H., & Lee, P. J. (2019). “How residents in multifamily housing cope with neighbournoise: The role of attitude towards the Neighbours,” Journal of Community Psychology, 47(8), 1909–1925.
Ragoowansi, Henna. (2020). Mobile Home Parks and Noise Complaints. Unpublished manuscript.
Riedel, F. (2020). ‘Introduction’. In F. Riedel and J. Torvinen (eds.) Music as Atmosphere. New York, NY: Routledge.
Shepherd, D., Welch, D., Dirks, K., & McBride, D. (2013). “Do quiet areas afford greater health-related quality of life than noisy areas?” International Journal of Environmental Research and Public Health, 10(4), 1284–1303.
Slaby, J. and C. von Scheve, eds. (2019). Affective Societies: Key Concepts. New York, NY: Routledge.
Stokoe, E., & Hepburn, A. (2005). ‘You can hear a lot through the walls’: Noise formulations in neighbour complaints,” Discourse & Society, 16(5), 647–673.
Trawick, M. W., & Howsen, R. M. (2006). “Crime and community heterogeneity: Race, ethnicity, and religion,” Applied Economics Letters, 13(6), 341–345.
Urdan, Timothy. (2010). Statistics in Plain English. New York, NY: Routledge.
- cf. Park 2019.
- Park & Lee, 2019.
- Urdan 2010:145.
- Iyengar, S., Sood, G., & Lelkes, Y. (2019); Legewie, J., & Schaeffer, M. (2016); Mutiara, M. (2018); Park, S. H., & Lee, P. J. (2019); Shepherd, D., Welch, D., Dirks, K., & McBride, D. (2013); Stokoe, E., & Hepburn, A. (2005); Trawick, M. W., & Howsen, R. M. (2006).
- Mühlhoff, R. (2019); McGraw, A. (In press); Riedel, F. (2020).; Slaby, J. and C. von Scheve, eds. (2019)